CPC-NWS-NOAA CDAS 200-hPa HT Anoms 04JUL2015
30-day loop of analyzed 200-hPa heights and anomalies. An eleven-day mean, centered on the date indicated in the title, of 200-hPa heights and anomalies from the NCEP Climate Data Assimilation System (CDAS), is shown for the first 25 days of the animation. 10-, 9-, 8-, 7-, and 6-day running means are shown for the last 5 days, respectively. Contour interval for heights is 120 m, anomalies are indicated by shading. Anomalies are departures from the 1981-2010 daily base period means. (Text after NOAA, 200 hecto Pascals Height Anomalies Animation)
Illustrates 2015 European and U.S. Wast coast heat waves.Relevante Bilder
Relevante Artikel
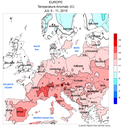
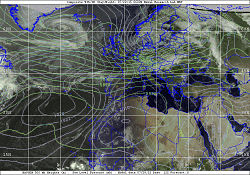
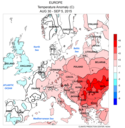
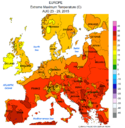
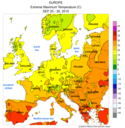
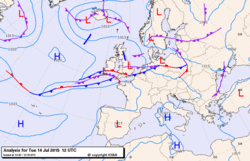
Hitzewellen in Europa 2015Ende Juni bis Mitte September des Jahres 2015 ereigneten sich ungewöhnliche Hitzewellen in Europa. Mit örtlich über 40 °C wurden verbreitet höchste Temperaturen seit Beginn der Wetteraufzeichnungen gemessen. Besonders betroffen waren die maghrebinische Mittelmeerküste, Südwest-, Zentral- und Südosteuropa mit einer der größten Hitzen der letzten Jahrzehnte. .. weiterlesen


