2008 Atlantic hurricane season summary map
Autor/Urheber:
Supportstorm
Shortlink:
Quelle:
Größe:
4000 x 2476 Pixel (6442425 Bytes)
Beschreibung:
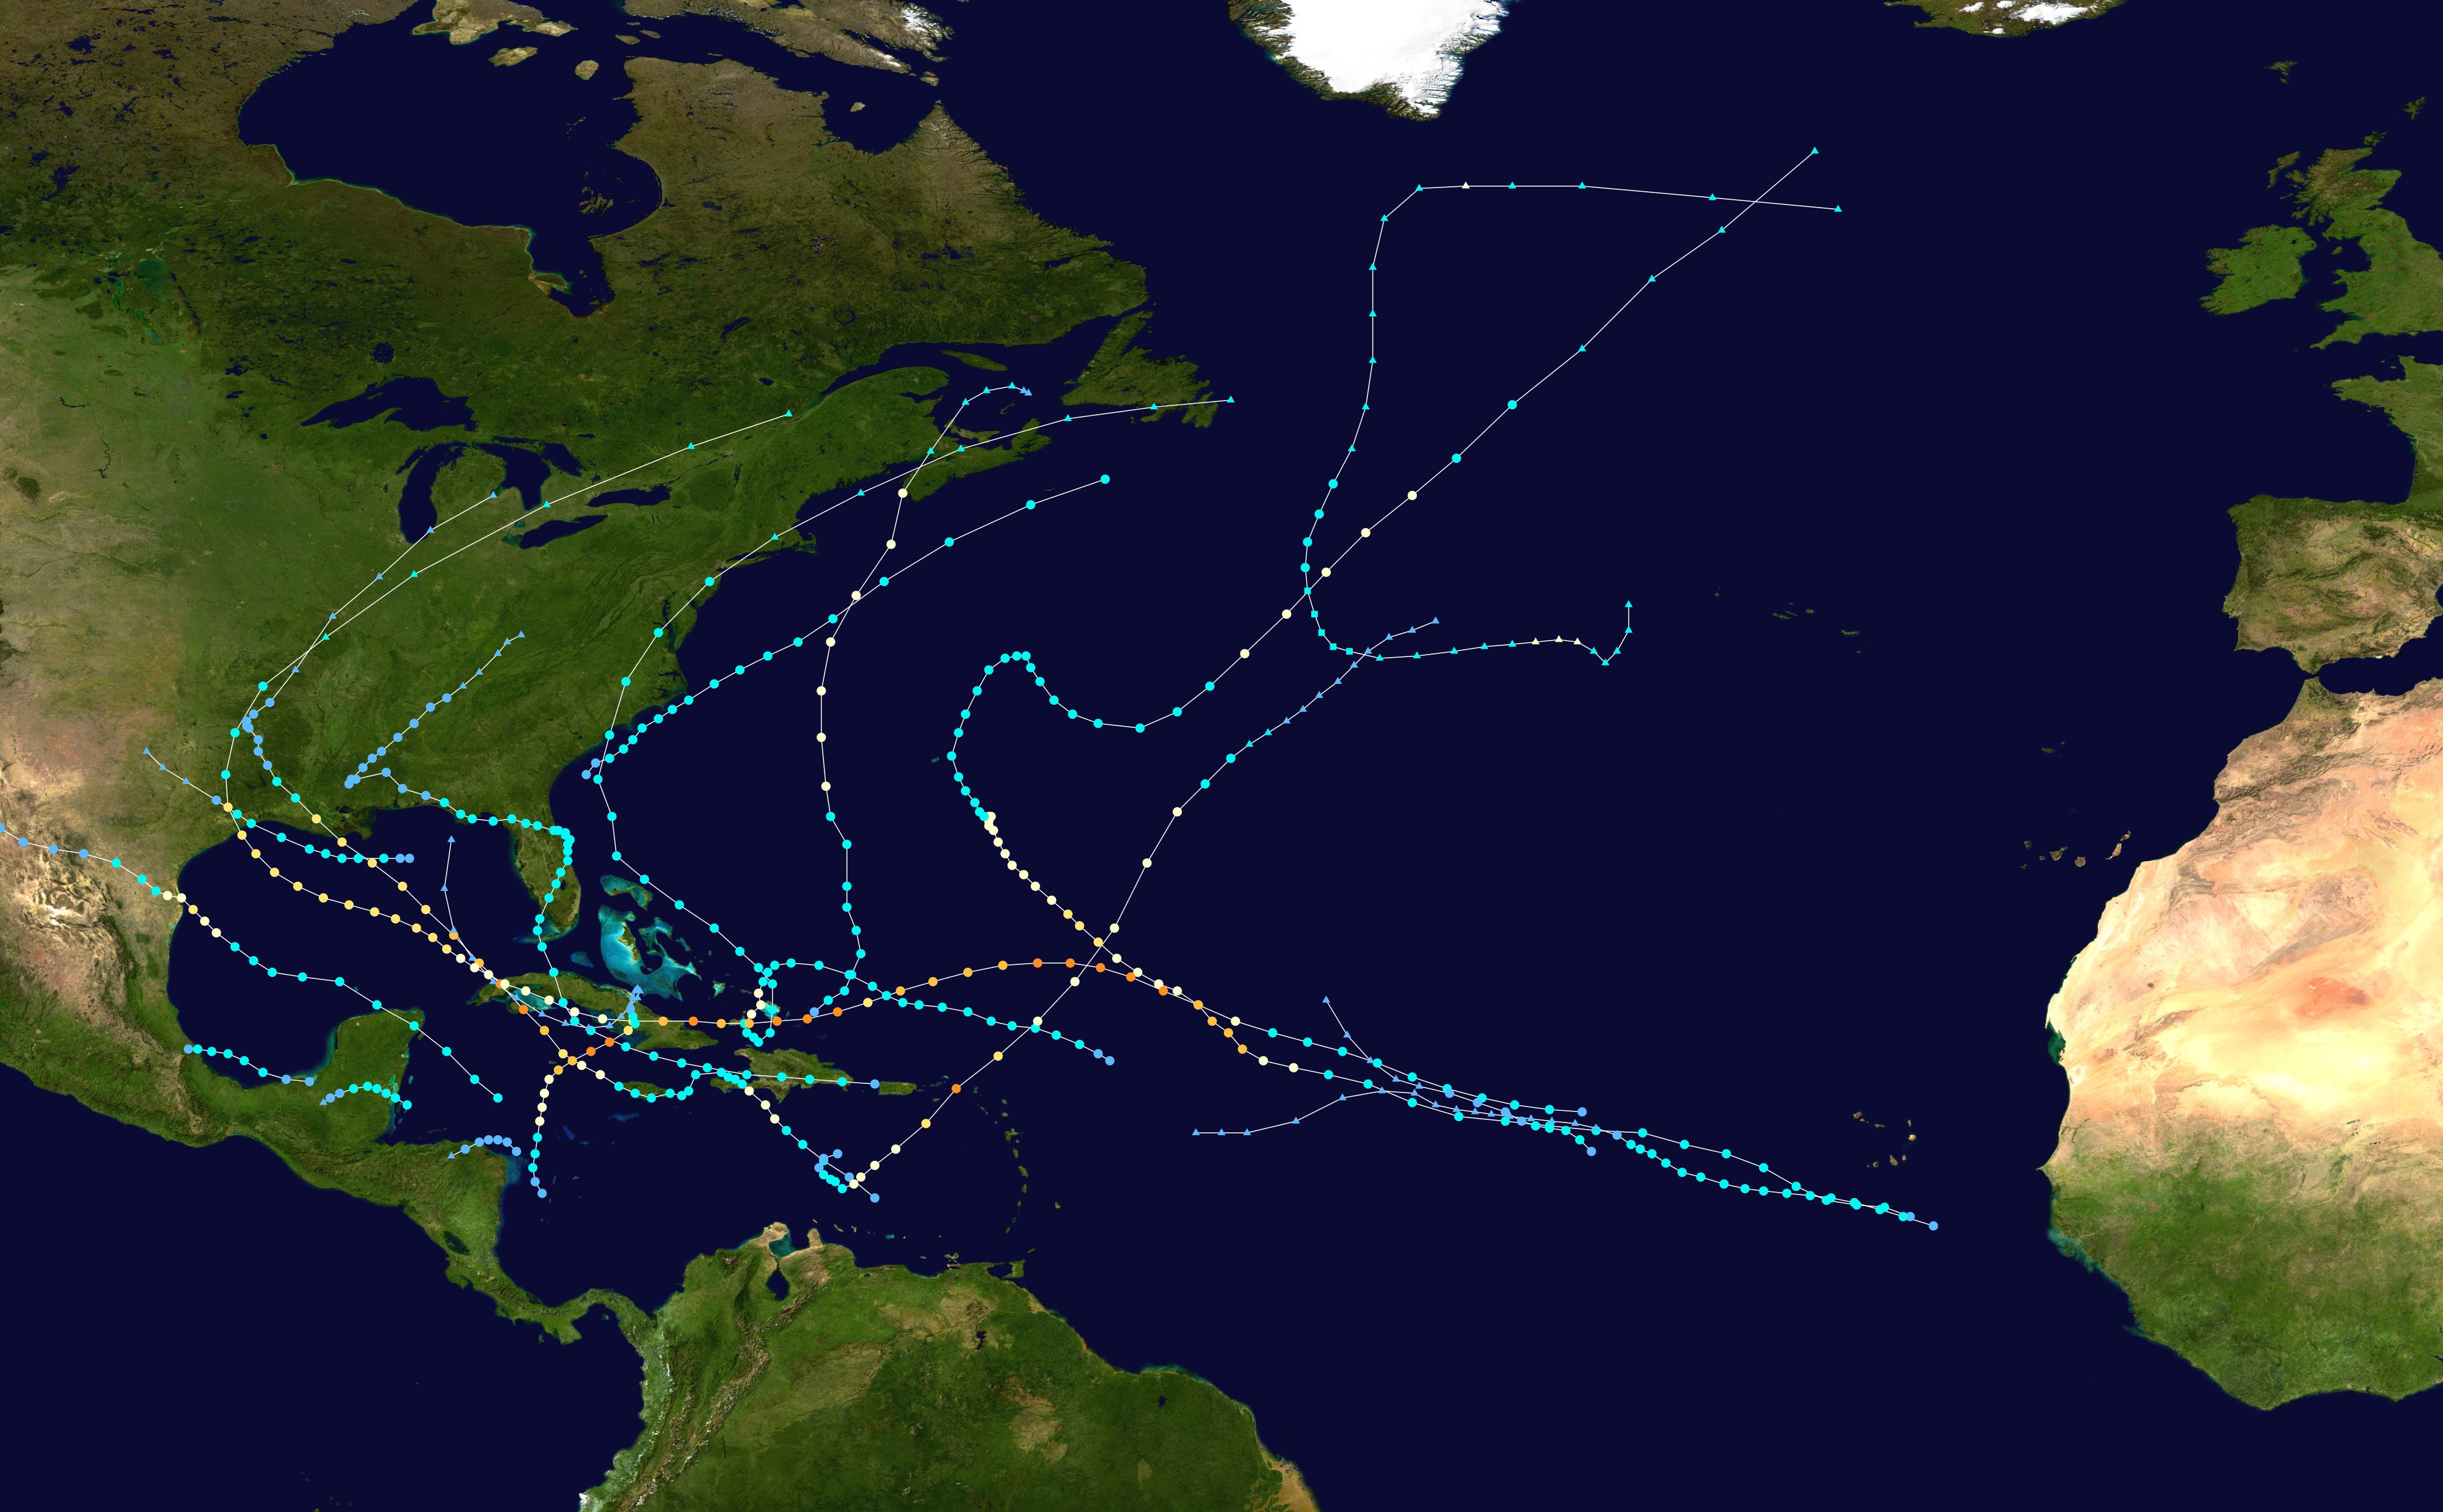
This map shows the tracks of all tropical cyclones in the 2008 Atlantic hurricane season. The points show the location of each storm at 6-hour intervals. The colour represents the storm's maximum sustained wind speeds as classified in the Saffir-Simpson Hurricane Scale (see below), and the shape of the data points represent the type of the storm.
Lizenz:
Public domain
Credit:
Created using Wikipedia:WikiProject Tropical cyclones/Tracks. The background image is from NASA [1]. The tracking data is from the National Hurricane Center's Atlantic hurricane database
Bild teilen:


Relevante Bilder


Relevante Artikel
Atlantische Hurrikansaison 2008Die Atlantische Hurrikansaison 2008 begann offiziell am 1. Juni und endete am 30. November 2008. Innerhalb dieser Periode bilden sich die meisten tropischen Stürme, da nur zu dieser Zeit geeignete Bedingungen, wie etwa ein warmer Ozean, feuchte Luft und wenig Windscherung, existieren, um die Bildung von tropischen Wirbelstürmen zu ermöglichen. Stürme im östlichen Pazifischen Ozean sind Bestandteil der Pazifischen Hurrikansaison 2008. .. weiterlesen