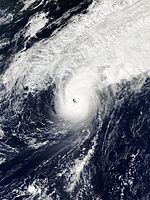
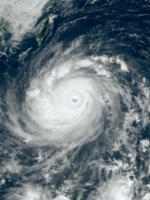
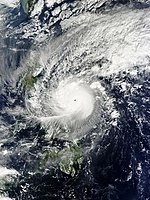
Pazifische Taifunsaison 2016
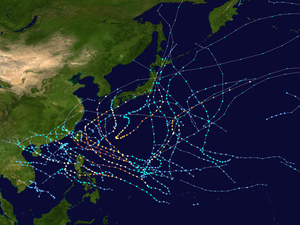 Alle Stürme der Saison | |
| Bildung des ersten Sturms | 26. Mai 2016 |
|---|---|
| Auflösung des letzten Sturms | 28. Dezember 2016 |
| Stärkster Sturm | Meranti (Ferdie), 17W – 890 hPa (mbar), 120 kn (220 km/h) (10-minütig) |
| Tropische Tiefs | 50 |
| Stürme | 26 |
| Taifune | 13 |
| Supertaifune (JTWC) | 6 |
| Opferzahl gesamt | mindestens 873 |
| Gesamtschaden | 9,64 Milliarden $ (2016) |
| Pazifische Taifunsaison 2014, 2015, 2016, 2017, 2018 | |
Die Pazifische Taifunsaison 2016 ist ein Wetterereignis, unter dem die während des Kalenderjahres 2016 entstandenen tropischen Wirbelstürme des Nordwest-Pazifik (westlich des 180. Längengrads und nördlich des Äquators) zusammengefasst sind. Wirbelstürme in diesem Gebiet nennt man Taifune, östlich des 180. Längengrads heißen sie dagegen Hurrikane und sind Gegenstand der Pazifischen Hurrikansaisons. Tropische Wirbelstürme im Südpazifik heißen Zyklone und werden in den Südpazifischen Zyklonsaisons und den Australischen Zyklonsaisons zusammengefasst. Die meisten Taifune bilden sich zwischen Mai und November, daher die jährliche Zusammenfassung zu Saisons. In geringerer Häufung entstehen sie aber auch regelmäßig zu allen anderen Jahreszeiten.[1]
Innerhalb des nordwestlichen Pazifiks gibt es zwei meteorologische Organisationen, die den Stürmen Namen vergeben. Dies führt dazu, dass derselbe Sturm häufig zwei verschiedene Namen erhält. Die offizielle Bezeichnung durch die Japan Meteorological Agency (JMA) erhält ein tropischer Sturm, sobald er an einer beliebigen Stelle im nordwestlichen Pazifik andauernde 10-minütige Windgeschwindigkeiten von 35 Knoten (rund 65 km/h) erreicht. Die Philippine Atmospheric, Geophysical and Astronomical Services Administration (PAGASA) hingegen weist tropischen Tiefdruckgebieten Namen zu, die sich innerhalb des nationalen Verantwortungsbereiches bilden oder dorthin ziehen; dieser Verantwortungsbereich liegt grob umgrenzt zwischen 115° und 135° östlicher Länge und zwischen 5° und 25° nördlicher Breite. PAGASA weist auch dann einen lokalen Namen zu, wenn das System bereits durch die Japan Meteorological Agency benannt wurde. Tropische Tiefdruckgebiete, die vom US-amerikanischen Joint Typhoon Warning Center beobachtet werden, erhalten eine Nummer mit dem Suffix W.
Stürme
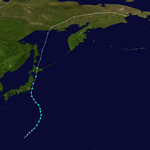
Tropische Depression 01W
| Tropische Depression (JMA) | |||
|---|---|---|---|
| Tropisches Tiefdruckgebiet | |||
| |||
| Dauer | 26. Mai – 27. Mai | ||
| Intensität | 25 kn (45 km/h) (1-minütig), 998 hPa | ||
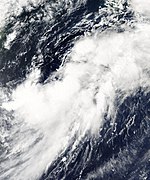
Tropische Depression Ambo
| Tropische Depression (JMA) | |||
|---|---|---|---|
| Tropisches Tiefdruckgebiet | |||
| |||
| Dauer | 26. Juni – 28. Juni | ||
| Intensität | 30 kn (55 km/h) (1-minütig), 1002 hPa | ||
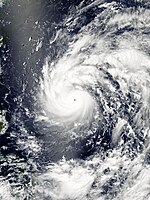
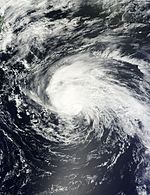
Taifun Nepartak (Butchoy)
| Taifun (JMA) | |||
|---|---|---|---|
| Kategorie-5-Super-Taifun | |||
| |||
| Dauer | 2. Juli – 10. Juli | ||
| Intensität | 110 kn (205 km/h) (10-minütig), 900 hPa | ||
Tropische Depression 03W
| Tropische Depression (JMA) | |||
|---|---|---|---|
| Tropisches Tiefdruckgebiet | |||
| |||
| Dauer | 15. Juli – 20. Juli | ||
| Intensität | 25 kn (45 km/h) (1-minütig), 1006 hPa | ||
Tropischer Sturm Lupit
| Tropischer Sturm (JMA) | |||
|---|---|---|---|
| Tropischer Sturm | |||
| |||
| Dauer | 22. Juli – 24. Juli | ||
| Intensität | 40 kn (75 km/h) (10-minütig), 1000 hPa | ||
Starker tropischer Sturm Mirinae
| Schwerer tropischer Sturm (JMA) | |||
|---|---|---|---|
| Tropischer Sturm | |||
| |||
| Dauer | 25. Juli – 29. Juli | ||
| Intensität | 55 kn (100 km/h) (10-minütig), 980 hPa | ||
Starker tropischer Sturm Nida (Carina)
| Schwerer tropischer Sturm (JMA) | |||
|---|---|---|---|
| Kategorie-1-Taifun | |||
| |||
| Dauer | 29. Juli – 3. August | ||
| Intensität | 60 kn (110 km/h) (10-minütig), 975 hPa | ||
Starker tropischer Sturm Omais
| Schwerer tropischer Sturm (JMA) | |||
|---|---|---|---|
| Tropischer Sturm | |||
| |||
| Dauer | 3. August – 9. August | ||
| Intensität | 60 kn (110 km/h) (10-minütig), 975 hPa | ||
Starker tropischer Sturm Conson
| Schwerer tropischer Sturm (JMA) | |||
|---|---|---|---|
| Tropischer Sturm | |||
| |||
| Dauer | 7. August – 15. August | ||
| Intensität | 50 kn (95 km/h) (10-minütig), 985 hPa | ||
Starker tropischer Sturm Chanthu
| Schwerer tropischer Sturm (JMA) | |||
|---|---|---|---|
| Tropischer Sturm | |||
| |||
| Dauer | 7. August – 15. August | ||
| Intensität | 55 kn (100 km/h) (10-minütig), 980 hPa | ||
Tropischer Sturm Dianmu
| Tropischer Sturm (JMA) | |||
|---|---|---|---|
| Tropischer Sturm | |||
| |||
| Dauer | 15. August – 19. August | ||
| Intensität | 40 kn (75 km/h) (10-minütig), 985 hPa | ||
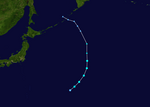
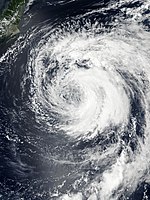
Taifun Lionrock (Dindo)
| Taifun (JMA) | |||
|---|---|---|---|
| Kategorie-4-Taifun | |||
| |||
| Dauer | 16. August – 30. August | ||
| Intensität | 90 kn (165 km/h) (10-minütig), 940 hPa | ||
Taifun Mindulle
| Taifun (JMA) | |||
|---|---|---|---|
| Tropischer Sturm | |||
| |||
| Dauer | 17. August – 23. August | ||
| Intensität | 65 kn (120 km/h) (10-minütig), 975 hPa | ||
Tropischer Sturm Kompasu
| Tropischer Sturm (JMA) | |||
|---|---|---|---|
| Tropischer Sturm | |||
| |||
| Dauer | 18. August – 21. August | ||
| Intensität | 35 kn (65 km/h) (10-minütig), 994 hPa | ||
Tropische Depression 14W
| Tropische Depression (JMA) | |||
|---|---|---|---|
| Tropisches Tiefdruckgebiet | |||
| |||
| Dauer | 23. August – 24. August | ||
| Intensität | 30 kn (55 km/h) (10-minütig), 1000 hPa | ||
Taifun Namtheun (Enteng)
| Taifun (JMA) | |||
|---|---|---|---|
| Kategorie-3-Taifun | |||
| |||
| Dauer | 31. August – 5. September | ||
| Intensität | 75 kn (140 km/h) (10-minütig), 955 hPa | ||
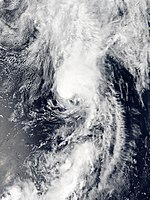
Tropischer Sturm Malou
| Tropischer Sturm (JMA) | |||
|---|---|---|---|
| |||
| Dauer | 5. September – 7. September | ||
| Intensität | 40 kn (75 km/h) (10-minütig), 1000 hPa | ||
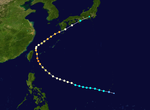
Taifun Meranti (Ferdie)
| Taifun (JMA) | |||
|---|---|---|---|
| Kategorie-5-Super-Taifun | |||
| |||
| Dauer | 8. September – 17. September | ||
| Intensität | 115 kn (215 km/h) (10-minütig), 905 hPa | ||
Tropische Depression 17W
| Tropische Depression (JMA) | |||
|---|---|---|---|
| Tropisches Tiefdruckgebiet | |||
| |||
| Dauer | 8. September – | ||
| Intensität | 30 kn (55 km/h) (1-minütig), 1000 hPa | ||
Tropischer Sturm Rai
| Tropischer Sturm (JMA) | |||
|---|---|---|---|
| Tropisches Tiefdruckgebiet | |||
| |||
| Dauer | 11. September – 13. September | ||
| Intensität | 35 kn (65 km/h) (10-minütig), 996 hPa | ||
Taifun Malakas (Gener)
| Taifun (JMA) | |||
|---|---|---|---|
| Kategorie-4-Taifun | |||
| |||
| Dauer | 11. September – 20. September | ||
| Intensität | 95 kn (175 km/h) (10-minütig), 930 hPa | ||
Taifun Megi (Helen)
| Taifun (JMA) | |||
|---|---|---|---|
| Kategorie-3-Taifun | |||
| |||
| Dauer | 22. September – 29. September | ||
| Intensität | 85 kn (155 km/h) (10-minütig), 945 hPa | ||
Taifun Chaba (Igme)
| Taifun (JMA) | |||
|---|---|---|---|
| Kategorie-5-Super-Taifun | |||
| |||
| Dauer | 24. September – 5. Oktober | ||
| Intensität | 115 kn (215 km/h) (10-minütig), 905 hPa | ||
Taifun Songda
| Taifun (JMA) | |||
|---|---|---|---|
| Kategorie-4-Super-Taifun | |||
| |||
| Dauer | 4. Oktober(im Ostpazifik) – 13. Oktober | ||
| Intensität | 100 kn (185 km/h) (10-minütig), 925 hPa | ||
Schwerer Tropischer Sturm Aere (Julian)
| Schwerer tropischer Sturm (JMA) | |||
|---|---|---|---|
| Tropischer Sturm | |||
| |||
| Dauer | 4. Oktober – 10. Oktober | ||
| Intensität | 60 kn (110 km/h) (10-minütig), 975 hPa | ||
Taifun Sarika (Karen)
| Taifun (JMA) | |||
|---|---|---|---|
| Kategorie-4-Taifun | |||
| |||
| Dauer | 13.Oktober – 19. Oktober | ||
| Intensität | 95 kn (175 km/h) (10-minütig), 935 hPa | ||
Taifun Haima (Lawin)
| Taifun (JMA) | |||
|---|---|---|---|
| Kategorie-5-Super-Taifun | |||
| |||
| Dauer | 14. Oktober – 21. Oktober | ||
| Intensität | 115 kn (215 km/h) (10-minütig), 900 hPa | ||
Taifun Meari
| Taifun (JMA) | |||
|---|---|---|---|
| Kategorie-2-Taifun | |||
| |||
| Dauer | 30. Oktober – 7. November | ||
| Intensität | 75 kn (140 km/h) (10-minütig), 960 hPa | ||
Tropische Depression
| Tropische Depression (JMA) | |||
|---|---|---|---|
| |||
| Dauer | 3. November – 6. November | ||
| Intensität | 30 kn (55 km/h) (10-minütig), 1004 hPa | ||
Tropische Sturm Ma-on
| Tropischer Sturm (JMA) | |||
|---|---|---|---|
| Tropischer Sturm | |||
| |||
| Dauer | 8. November – 13. November | ||
| Intensität | 35 kn (65 km/h) (10-minütig), 1002 hPa | ||
Tropische Depression 28W
| Tropische Depression (JMA) | |||
|---|---|---|---|
| Tropisches Tiefdruckgebiet | |||
| |||
| Dauer | 9. November – 12. November | ||
| Intensität | 30 kn (55 km/h) (1-minütig), 1008 hPa | ||
Schwerer Tropischer Sturm Tokage (Marce)
| Schwerer tropischer Sturm (JMA) | |||
|---|---|---|---|
| Tropischer Sturm | |||
| |||
| Dauer | 23. November – 28. November | ||
| Intensität | 50 kn (95 km/h) (10-minütig), 992 hPa | ||
Taifun Nock-ten (Nina)
| Taifun (JMA) | |||
|---|---|---|---|
| Kategorie-5-Super-Taifun | |||
| |||
| Dauer | 21. Dezember – 28. Dezember | ||
| Intensität | 100 kn (185 km/h) (10-minütig), 915 hPa | ||
Sturmnamen
Internationale Namen
Tropische Wirbelstürme im westlichen Nordpazifik werden durch das zuständige Regional Specialized Meteorological Centre in Tokio der Japan Meteorological Agency benannt. Diese erhalten einen Namen, sobald sie die Stärke eines tropischen Sturmes erreichen.[2] Die Namen entstammen der folgenden Liste; diese wird fortlaufend verwendet, es gibt also keine jährlich wechselnden Namenslisten wie im östlichen Nordpazifik oder im Atlantik. Die Namen wurden durch die 14 Mitgliedsstaaten des ESCAP/WMO Typhoon Committees vorgeschlagen. Jedes dieser Mitglieder hat jeweils zehn Namen eingereicht, die in alphabetischer Reihenfolge nach der englischen Schreibweise dieser Staaten sortiert vergeben werden.[3] Die folgenden Namen wurden für benannte Stürme benutzt:
- Nepartak, Lupit, Mirinae, Nida, Omais, Conson, Chanthu, Dianmu, Mindulle, Lionrock, Kompasu, Namtheun, Malou, Meranti, Rai, Malakas, Megi, Chaba, Aere, Songda, Sarika, Haima, Meari, Ma-on, Tokage und Nock-ten
Philippinen
Die Philippine Atmospheric, Geophysical and Astronomical Services Administration (PAGASA) verwendet für tropische Systeme in ihrem Verantwortungsbereich ein eigenes Namensschema. Die Namenslisten von PAGASA werden alle vier Jahre wieder verwendet. Diese Namen werden für Systeme vergeben, die sich im Verantwortungsbereich von PAGASA zwischen 115° und 135° östlicher Länge und zwischen 5° und 25° nördlicher Breite bilden oder in dieses Gebiet hineinwandern. Sollte sich die Namensliste als nicht ausreichend erweisen, werden die Namen von einer Ersatzliste genommen.[4] Dies ist dieselbe Liste, die auch in der Saison 2012 verwendet wurde, nur Pablo wurde aufgrund der großen Opferzahlen des gleichnamigen Taifuns 2012 im Süden des Landes durch Pepito ersetzt. Die folgenden Namen wurden für benannte Stürme benutzt:
- Ambo, Butchoy, Carina, Dindo, Enteng, Ferdie, Gener, Helen, Igme, Julian, Karen, Lawin, Marce und Nina
Siehe auch
- Australische Zyklonsaison 2016/17
- Pazifische Hurrikansaison 2016
- Zyklonsaison 2016/17 im südwestlichen Indischen Ozean
- Südpazifische Zyklonsaison 2015/16
- Zyklonsaison 2015/16 im südwestlichen Indischen Ozean
- Australische Zyklonsaison 2015/16
- Südpazifische Zyklonsaison 2016/17
- Atlantische Hurrikansaison 2016
- Zyklonsaison 2016 im nördlichen Indischen Ozean
Weblinks
- TCWC Jakarta
- Japan Meteorological Agency
- Typhoon2000 Philippine Typhoon Website
- Hong Kong Observatory
- Korea Meteorological Administration
- Digital Typhoon – Typhoon Images and Information
- China Meteorological Administration
- Vietnam’s National Hydro-Meteorological Service
- Philippine Atmospheric, Geophysical and Astronomical Services Administration
- Thai Meteorological Department
- Malaysian Meteorological Department
- Taiwan Central Weather Bureau
- National Weather Service Guam
- Joint Typhoon Warning Center
Belege
- ↑ Gary Padgett: Monthly Global Tropical Cyclone Summary May 2003. Australian Severe Weather, abgerufen am 29. Dezember 2013 (englisch).
- ↑ Gary Padgett: Monthly Global Tropical Cyclone Summary December 1999. Australian Severe Weather, abgerufen am 29. Dezember 2013 (englisch).
- ↑ List of Names for Tropical Cyclones adopted by the ESCAP/WMO Typhoon Committee for the Western North Pacific and the South China Sea. Japan Meteorological Agency, abgerufen am 1. Januar 2016 (englisch).
- ↑ Tropical Cyclone Information. PAGASA, archiviert vom am 22. Dezember 2015; abgerufen am 1. Januar 2016 (englisch). Info: Der Archivlink wurde automatisch eingesetzt und noch nicht geprüft. Bitte prüfe Original- und Archivlink gemäß Anleitung und entferne dann diesen Hinweis.
Auf dieser Seite verwendete Medien
Track map of Tropical Storm Ma-on of the 2016 Pacific typhoon season. The points show the location of the storm at 6-hour intervals. The colour represents the storm's maximum sustained wind speeds as classified in the (see below), and the shape of the data points represent the nature of the storm, according to the legend below.
Storm type
Typhoon Megi making landfall over Taiwan at peak intensity on September 27, 2016.
Track map of Severe Tropical Storm Omais of the 2016 Pacific typhoon season. The points show the location of the storm at 6-hour intervals. The colour represents the storm's maximum sustained wind speeds as classified in the (see below), and the shape of the data points represent the nature of the storm, according to the legend below.
Storm type
A newly-formed tropical depression northeast of the Philippines on June 26, 2016, shortly before the PAGASA tracking the depression.
Track map of Typhoon Chaba of the 2016 Pacific typhoon season. The points show the location of the storm at 6-hour intervals. The colour represents the storm's maximum sustained wind speeds as classified in the (see below), and the shape of the data points represent the nature of the storm, according to the legend below.
Storm type
Track map of Tropical Depression 01W of the 2016 Pacific typhoon season. The points show the location of the storm at 6-hour intervals. The colour represents the storm's maximum sustained wind speeds as classified in the (see below), and the shape of the data points represent the nature of the storm, according to the legend below.
Storm type
Tropical Storm Ma-on (27W) in the western Pacific
Track map of Tropical Depression 28W of the 2016 Pacific typhoon season. The points show the location of the storm at 6-hour intervals. The colour represents the storm's maximum sustained wind speeds as classified in the (see below), and the shape of the data points represent the nature of the storm, according to the legend below.
Storm type
Track map of Tropical Storm Lupit of the 2016 Pacific typhoon season. The points show the location of the storm at 6-hour intervals. The colour represents the storm's maximum sustained wind speeds as classified in the (see below), and the shape of the data points represent the nature of the storm, according to the legend below.
Storm type
Track map of Typhoon Sarika of the 2016 Pacific typhoon season. The points show the location of the storm at 6-hour intervals. The colour represents the storm's maximum sustained wind speeds as classified in the (see below), and the shape of the data points represent the nature of the storm, according to the legend below.
Storm type
Track map of Severe Tropical Storm Chanthu of the 2016 Pacific typhoon season. The points show the location of the storm at 6-hour intervals. The colour represents the storm's maximum sustained wind speeds as classified in the (see below), and the shape of the data points represent the nature of the storm, according to the legend below.
Storm type
Track map of Typhoon Nepartak of the 2016 Pacific typhoon season. The points show the location of the storm at 6-hour intervals. The colour represents the storm's maximum sustained wind speeds as classified in the (see below), and the shape of the data points represent the nature of the storm, according to the legend below.
Storm type
Tropical Depression 17W east of Japan on September 11, 2016
Tropical Storm Aere (22W) off southeast China
Tropical Storm Rai over land in Vietnam on September 13, 2016
Track map of Typhoon Meari of the 2016 Pacific typhoon season. The points show the location of the storm at 6-hour intervals. The colour represents the storm's maximum sustained wind speeds as classified in the (see below), and the shape of the data points represent the nature of the storm, according to the legend below.
Storm type
Track map of Tropical Depression 14W of the 2016 Pacific typhoon season. The points show the location of the storm at 6-hour intervals. The colour represents the storm's maximum sustained wind speeds as classified in the (see below), and the shape of the data points represent the nature of the storm, according to the legend below.
Storm type
Tropical Depression 14W as a very weak system near the Mariana Islands on August 24, 2016
Typhoon Meari (26W) in the western Pacific
Typhoon Mindulle over the Greater Tokyo Area of Japan on August 22, 2016.
Track map of Tropical Storm Malou of the 2016 Pacific typhoon season. The points show the location of the storm at 6-hour intervals. The colour represents the storm's maximum sustained wind speeds as classified in the (see below), and the shape of the data points represent the nature of the storm, according to the legend below.
Storm type
Tropical Storm Tokage (29W) in the South China Sea
Track map of Tropical Depression 17W of the 2016 Pacific typhoon season. The points show the location of the storm at 6-hour intervals. The colour represents the storm's maximum sustained wind speeds as classified in the (see below), and the shape of the data points represent the nature of the storm, according to the legend below.
Storm type
Track map of Tropical Storm Rai of the 2016 Pacific typhoon season. The points show the location of the storm at 6-hour intervals. The colour represents the storm's maximum sustained wind speeds as classified in the (see below), and the shape of the data points represent the nature of the storm, according to the legend below.
Storm type
Track map of Typhoon Meranti of the 2016 Pacific typhoon season. The points show the location of the storm at 6-hour intervals. The colour represents the storm's maximum sustained wind speeds as classified in the (see below), and the shape of the data points represent the nature of the storm, according to the legend below.
Storm type
Tropical Depression Dianmu (11W) over southern China
Typhoon Chaba reaching its peak intensity near Okinawa, Japan on October 3, 2016.
Tropical Storm Mirinae approaching Hainan, China on July 26, 2016.
The Japan Meteorological Agency’s Himawari-8 satellite captured this picture of Typhoon Lionrock on August 28, 2016, when the system was located to the south of Japan. At the moment, Lionrock reached peak intensity and was approaching the Tōhoku region of Japan.
Track map of Tropical Depression 03W of the 2016 Pacific typhoon season. The points show the location of the storm at 6-hour intervals. The colour represents the storm's maximum sustained wind speeds as classified in the (see below), and the shape of the data points represent the nature of the storm, according to the legend below.
Storm type
The Operational Linescan System (OLS) Satellite captured this Infrared Satellite Image of Muifa at peak intensity with an unofficial central pressure of 918hpa as sated by the JTWC late on July 30 2011 over the the Philippine Sea.
Track map of Typhoon Namtheun of the 2016 Pacific typhoon season. The points show the location of the storm at 6-hour intervals. The colour represents the storm's maximum sustained wind speeds as classified in the (see below), and the shape of the data points represent the nature of the storm, according to the legend below.
Storm type
Track map of JMA Tropical Depression Forty-five of the 2016 Pacific typhoon season. The points show the location of the storm at 6-hour intervals. The colour represents the storm's maximum sustained wind speeds as classified in the (see below), and the shape of the data points represent the nature of the storm, according to the legend below.
Storm type
Track map of Tropical Storm Kompasu of the 2016 Pacific typhoon season. The points show the location of the storm at 6-hour intervals. The colour represents the storm's maximum sustained wind speeds as classified in the (see below), and the shape of the data points represent the nature of the storm, according to the legend below.
Storm type
This map shows the tracks of all tropical cyclones in the 2016 Pacific typhoon season. The points show the location of each storm at 6-hour intervals. The colour represents the storm's maximum sustained wind speeds as classified in the Saffir-Simpson Hurricane Scale (see below), and the shape of the data points represent the type of the storm.
Typhoon Nepartak at peak intensity with a pinhole eye on July 6, 2016.
Track map of Typhoon Lionrock of the 2016 Pacific typhoon season. The points show the location of the storm at 6-hour intervals. The colour represents the storm's maximum sustained wind speeds as classified in the (see below), and the shape of the data points represent the nature of the storm, according to the legend below.
Storm type
Track map of Severe Tropical Storm Aere of the 2016 Pacific typhoon season. The points show the location of the storm at 6-hour intervals. The colour represents the storm's maximum sustained wind speeds as classified in the (see below), and the shape of the data points represent the nature of the storm, according to the legend below.
Storm type
JMA Tropical Depression 43 near the southern coast of Vietnam on November 4, 2016
Track map of Severe Tropical Storm Nida of the 2016 Pacific typhoon season. The points show the location of the storm at 6-hour intervals. The colour represents the storm's maximum sustained wind speeds as classified in the (see below), and the shape of the data points represent the nature of the storm, according to the legend below.
Storm type
Track map of Typhoon Haima of the 2016 Pacific typhoon season. The points show the location of the storm at 6-hour intervals. The colour represents the storm's maximum sustained wind speeds as classified in the (see below), and the shape of the data points represent the nature of the storm, according to the legend below.
Storm type
Track map of Typhoon Megi of the 2016 Pacific typhoon season. The points show the location of the storm at 6-hour intervals. The colour represents the storm's maximum sustained wind speeds as classified in the (see below), and the shape of the data points represent the nature of the storm, according to the legend below.
Storm type
"Tropical Storm" Malou shortly before it began accelerating on September 6, 2016
Track map of Typhoon Malakas of the 2016 Pacific typhoon season. The points show the location of the storm at 6-hour intervals. The colour represents the storm's maximum sustained wind speeds as classified in the (see below), and the shape of the data points represent the nature of the storm, according to the legend below.
Storm type
Tropical Depression 28W over the Marshall Islands on November 10, 2016
Track map of Typhoon Songda of the 2016 Pacific typhoon season. The points show the location of the storm at 6-hour intervals. The colour represents the storm's maximum sustained wind speeds as classified in the (see below), and the shape of the data points represent the nature of the storm, according to the legend below.
Storm type
Tropical Storm Kompasu during the time it was upgraded into a tropical storm by the JMA, on August 20, 2016
Typhoon Haima approaching the Philippines at peak intensity on October 19, 2016.
Track map of Tropical Storm Tokage of the 2016 Pacific typhoon season. The points show the location of the storm at 6-hour intervals. The colour represents the storm's maximum sustained wind speeds as classified in the (see below), and the shape of the data points represent the nature of the storm, according to the legend below.
Storm type
JMA Tropical Depression 01 or Invest 90W near Yangjiang, China on May 27, 2016
Severe Tropical Storm Omais southeast of Japan on August 7, 2016.
Track map of Tropical Storm Conson of the 2016 Pacific typhoon season. The points show the location of the storm at 6-hour intervals. The colour represents the storm's maximum sustained wind speeds as classified in the (see below), and the shape of the data points represent the nature of the storm, according to the legend below.
Storm type
Tropical Depression 03W over Philippine Sea on July 17, 2016
Typhoon Songda shortly after peak intensity southeast of Japan on October 12, 2016.
Track map of Tropical Storm Dianmu of the 2016 Pacific typhoon season. The points show the location of the storm at 6-hour intervals. The colour represents the storm's maximum sustained wind speeds as classified in the (see below), and the shape of the data points represent the nature of the storm, according to the legend below.
Storm type
Typhoon Nock-ten approaching the Bicol Region of the Philippines at peak intensity on December 25, 2016.
Tropical Storm Lupit east of Japan on July 24, 2016.
Typhoon Sarika (24W) over the Philippines
Tropical Storm Conson (08W) in the western Pacific Ocean
Track map of Typhoon Nock-ten of the 2016 Pacific typhoon season. The points show the location of the storm at 6-hour intervals. The colour represents the storm's maximum sustained wind speeds as classified in the (see below), and the shape of the data points represent the nature of the storm, according to the legend below.
Storm type
Track map of Severe Tropical Storm Mirinae of the 2016 Pacific typhoon season. The points show the location of the storm at 6-hour intervals. The colour represents the storm's maximum sustained wind speeds as classified in the (see below), and the shape of the data points represent the nature of the storm, according to the legend below.
Storm type
Tropical Storm Chanthu (09W) over Japan
Typhoon Meranti reaching its peak intensity east of Batanes, Philippines on September 13, 2016.
Typhoon Namtheun east of Okinawa Island on September 2, 2016.
Track map of Typhoon Mindulle of the 2016 Pacific typhoon season. The points show the location of the storm at 6-hour intervals. The colour represents the storm's maximum sustained wind speeds as classified in the (see below), and the shape of the data points represent the nature of the storm, according to the legend below.
Storm type
Severe Tropical Storm Nida approaching Guangdong, China on August 1, 2016.
Track map of Tropical Depression Ambo of the 2016 Pacific typhoon season. The points show the location of the storm at 6-hour intervals. The colour represents the storm's maximum sustained wind speeds as classified in the (see below), and the shape of the data points represent the nature of the storm, according to the legend below.
Storm type


